One of the major time saving features of the Windchill Prediction tool is the built in Import Wizard. Instead of having to manually enter each part into the tool, Windchill Prediction can import a Bill of Materials (BOM) from common file formats such as Excel, Access, SML or Text File. This feature creates a simple step by step process that walks through the data importing process. If the BOMs are always created in the same format, once the first import has been mapped out, the settings can be saved to an Import/Export Template. This allows the user to select the template during future import processes, and saves the time required to map out data fields.
Create a new project to import the first BOM.
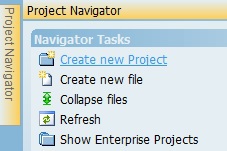 If you do not have an existing Project, a new Project must be created to import the data. To create a new
project, open the Project Navigator and click Create a New Project.
If you do not have an existing Project, a new Project must be created to import the data. To create a new
project, open the Project Navigator and click Create a New Project.
Now that a fresh, blank Project has been created, the BOM can be imported. To do this, use the built in Import Wizard. For this example, the import will be a parts list from an Excel file.
Using the Import Wizard
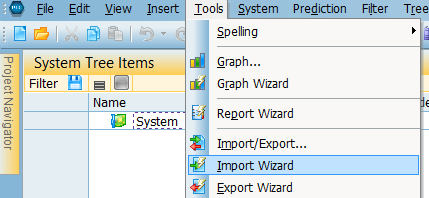
1. Open the Import Wizard
- From the Tools menu, select Import Wizard. Since this will be the first BOM imported, select Perform a custom import, and click Next.
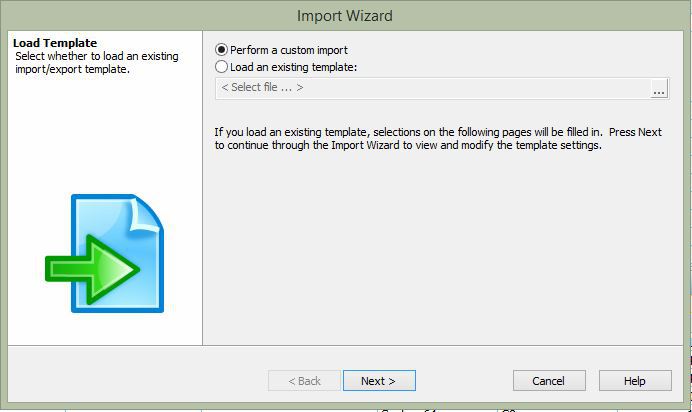
2. Importing A New Template Or Loading A Prexisting Template
- For this example, chose Perform a custom import and click Next. When importing a BOM for the first time or not loading a BOM from an existing template, this is the correct choice.
3. Browse To The Desired BOM File To Be Imported
- To browse to the to be imported, click the browse button [...] navigate to where the BOM file is located. Select the file, click Open, then Next.
Reliability Measurement Table
| Reliability Measure | Description |
|---|---|
| Failure Rate | The expected rate of occurrence of failure or the number of failures in a specified time period. Failure rate is typically expressed in failures per million or billion hours. For example, if your television has a failure rate of five failures per million hours, you can watch one million hour-long television shows and likely experience a failure during only five shows! |
| Mean Time Between Failures (MTBF) | The number of hours to pass between failures. MTBF is typically expressed in hours. As an example, if the MTBF of your television is 1000 hours, you can on average watch it for 1000 hours before it will fail. This does not indicate that your television will fail exactly in the 1000th hour of watching, but that it will generally fail somewhere around 1000 hours of operation. For many systems (those which are defined as "constant failure rate systems"), MTBF is the inverse of the failure rate. This means that if the failure rate is two failures per million hours, the MTBF is equal to 1000000/2, or 500,000 hours. |
| Mean Time to Failure (MTTF) | The average time to failure for a system that is not repairable. For example, a satellite is typically not repairable. In such a case, the MTTF, or Mean Time to Failure, is used as the metric for measuring reliability. Once the failure occurs, the system cannot be replaced or repaired. This is different from a repairable system (television) described in the above example. If your television fails somewhere around the 1000th hour, you will get it repaired. It will then operate for about another 1000 hours (on average) or so before it needs to be repaired again. |
| Reliability | The probability that the item will perform a required function without failure under stated conditions for a stated period of time. Reliability is significant because it takes into account time. The measure of reliability answers the question: "How likely is it that my system will remain operational over a certain period of time?" Because reliability is expressed as probability, it is always a value between 0 and 1. |
| Availability | Availability, also a probability value, indicates the probability that a system is operating at a particular point in time. It answers the question: "How likely is it that my system is operating X hours out of a Y hour time frame?" Availability differs from reliability because it factors repairs into the measurement. To determine availability, the time to perform a repair must be known. Because availability is expressed as a probability, it is a value between 0 and 1. |
| Mean Time to Repair (MTTR) | The average time to return a failed item to an operable state. The MTTR, or Mean Time to Repair, is normally expressed in hours and indicates how long it takes to repair a system that is down due to a failure. Generally, MTTR does not include logistics time, such as the time required to receive a replacement part. MTTR indicates the actual time it takes to correct the problem. |
| Unreliability | Unreliabiity is the complement of reliability. If your reliability is 0.9, the unreliability is equal to 0.1 (1.0 - 0.9). It is a probability value, or a number between 0 and 1, that indicates the likelihood that a system cannot continuously operate up to a specified point in time. |
| Unavailability | Like unreliability, unavailability is the complement of availability. It is a probability value, or a number between 0 and 1, that indicates the likelihood that a system is not operatinal for a specified period of time. |
There are many sources of confusion surrounding the use of reliability measures, especially in regards to MTTF and MTBF.
What reliability analysis techniques are currently available?
Because the reliability field is broad, there are many different types of reliability analysis techniques available. The table below outlines some of the more widely used analyses for reliability assessment. For organizational purposes, these techniques have been classified into three categories: Reliability Evaluation, Risk Assessment, and Specific Use Tools. However, the techniques are not limited to that one category (e.g. FTA can be used for Risk Assessment and Reliability Evaluation).
| Reliability Analysis Technique | Description |
|---|---|
|
Reliability Evaluation
The techniques is this category are used to determine system reliability metrics. |
|
| Reliability Prediction | Used to predict the likely failure rates of components and/or systems. Predicted failure rates are computed using statistically developed models based on component and environmental parameters. |
| Reliability Block Diagram (RBD) | Used to assess reliability metrics of complex systems that employ redundancy and other methods to increase reliability. RBDs use sophisticated modelling techniques, including system simulations, to determine reliability. |
| Markov Analysis | A very broad analysis tool that can be used to model a wide array of complex, state dependent systems. Markov analysis is used to calculate the reliability results for varied systems, especially those with sequence dependencies. |
|
Risk Assessment
The techniques in this category identify potential risk areas and assess techniques or actions that can be used to minimize risk factors. These techniques are used extensively in safety-related systems. |
|
| Failure Modes and Effects Analysis (FMEA) | Used to identify the effects of various failure modes on a system, identify how critical the effects of these failurs are on a system, and identify actions to elminate or mitigate those failure modes. |
| Fault Tree Analysis (FTA) | Used to identify all possible causes (or combination of cause) that result in a system failure. |
|
Specific Use Tools
The techniques in this category are used for a particular type of reliability assessment. |
|
| Failure Reporting, Analysis and Corrective Action System (FRACAS) | Widely used process for recording field failures, analyzing those failures for root cause, identifying trends across a population of products, and tracking corrective and preventive actions intended to preclude recurrence of the root cause. |
| Weibull Analysis | General, encompassing statistical tool for assessing failure time distributions via optimization techniques and predictive analyses. Used for failure forecasting based on sampls of actual field, or life data. |
| Accelerated Life Testing (ALT) | Uses statistical methods to analyze accelerated life testing data identify characteristic failure behavior and predict product reliability. |
| Maintainability Prediction | Used to determine the Mean Time to Repair (MTTR) for various components to aid in the development of maintenance plans for the system. |
| Life Cycle Cost Analysis | Used to determine the total lifetime costs of the system, factoring in metrics such as failure rates and repair costs. |
Oftentimes, the reliability analyst may employ several tools depending on requirements. For example, if you were required to forecast the rate at which the system will fail, you would have to perform a reliability prediction. If you were also required to identify all of the possible events that could result in a system failure, you would have to perform a FMEA.
Summary
The importance of reliability for business success is undeniable. To accurately track and measure reliability parameters, a wide array of techniques has been developed. Many of these analyses can be performed using software tools developed for the reliability practitioner. Windchill Quality Solutions is a reliability analysis toolset that can help you to perform a number of these analysis types. For additional information about Windchill Quality Solution software products, please visit crimsonquality.com/products.